Website monitoring, at its core, is more than just a means of keeping an eye on various metrics. Among other things, website monitoring allows you to maintain the right level of relationship between the website itself and the services related to its development. Not to mention, website user satisfaction levels will also be high if website performance monitoring works how it should.

It’s simple – with properly configured performance and stability monitoring, the website owner can quickly troubleshoot problems that arise. Accordingly, this helps to keep downtime to a minimum, as well as the time of various failures, ranging from the reduced speed of access to pages and server instability, and not loading for some reason content.
All of this directly affects the perception of the website by the services responsible for advertising, development and promotion. For example, Google Search and Google Ads immediately lower the rankings in their results if a website is slow or unavailable. Similarly, users are more likely to go to a competitor if they see any serious and lasting problems with the website.
The above means that it is obvious that monitoring the performance and stability of a website should be given quite a lot of attention. At a minimum, you need to understand how everything works, how to configure everything, and how to properly look for the sources of problems with the website when problems arise.
Website monitoring methods
When the Internet first started, website monitoring was a pretty simple thing. A few fairly simple tests were enough to keep almost everything under control. But today, the process has become so complex that all the methods and tools for diagnosing the performance and stability of websites have simply become impossible to generalize into one category.
Therefore, website monitoring tools and methods are divided into several subgroups or, rather, levels, the essence of each of which must be understood correctly. As it makes it much easier to respond to the appearance of problem signals in the logs of complex monitoring systems working in real-time.
Essentially, there are three types of website monitoring – synthetic monitoring, real-user monitoring (RUM) and application monitoring. And one of the most used monitoring methods is synthetic monitoring. It is the generic name for all tools related to the emulation of user requests or actions.
In simple terms, this group includes anything that allows you to reproduce, in one way or another, the actions of website visitors, which can somehow signal the appearance of critical errors. Typically, synthetic monitoring tools send requests to the website at certain intervals. More often than not, it is in accordance with a pre-configured schedule.
Such tools, quite obviously, also conduct logging in addition to the website testing itself. This allows the webmaster or website owner to track the occurrence of similar problems in the past and find patterns, and if necessary, to accurately indicate the time of the problem when contacting, for example, the support of the hosting provider.
Such an approach minimizes the chance of creating critical loads on the website or server. This is especially critical in situations where the website is already experiencing an influx of visitors.

Low-level monitoring basics and tools
Low-level website monitoring involves, quite logically, the use of basic stability and performance diagnostics. It includes mainly checking the website’s response to requests over the standard protocol stack, as well as general monitoring of the website’s uptime and stability. In other words, the foundation of all monitoring is working with HTTP, HTTPS and uptime and downtime metrics.
The best approach to basic monitoring, especially if advanced tools for your website are not too necessary at this stage of development, is to use automated monitoring systems. For example, using a tool to check website uptime with notifications – host tracker, as well as other basic tests available on this platform, makes it easy for even a novice to perform basic website diagnostics around the clock. HostTracker platform will not only keep logs, but will notify the website owner or webmaster if a problem occurs.
By doing just basic low-level website monitoring alone, you will be able to identify and even prevent a lot of website back-end problems, and troubleshoot accessibility and stability issues. But it is important to understand that this type of monitoring does not monitor the internal problems of the website or the server where it resides. And if your website has a complex structure and functionality, then you need a higher level of monitoring.
Mid-level monitoring and tools
As mentioned above, if your website needs more serious monitoring, you need to use more serious tools. And mid-level tools will allow you to take an in-depth look at the health, stability, and performance of your website along with an inside look at various networking problems.
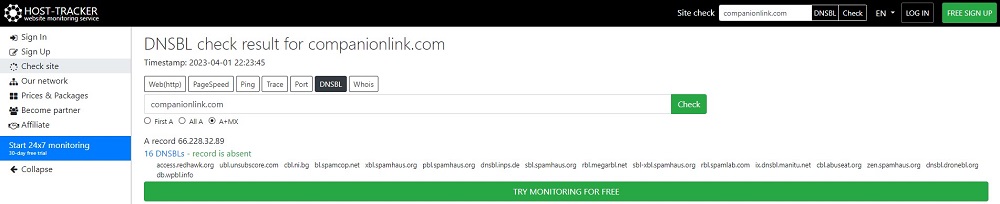
Mid-tier monitoring instruments, including website blacklist check service on host-tracker and a lot of other tools, simulate a network behavior along with a much larger number of types of user requests as well as various user actions. Which effectively makes mid-level website monitoring the entry level of functional monitoring.
But it’s worth keeping in mind that this approach is still far from full-fledged functional QA testing. Not even RUM tools, only a human tester capable of real-time client-side actions can perform it to the fullest extent. So you’ll only get basic information about the website’s response to an extended range of user requests.
High-level monitoring and tools
In addition to an extensive set of tests on various Internet protocols, high-level website monitoring includes diagnostics of TCP connections, various elements of web pages, functional add-ons and third-party applications, as well as internal diagnostics of server stability and performance.
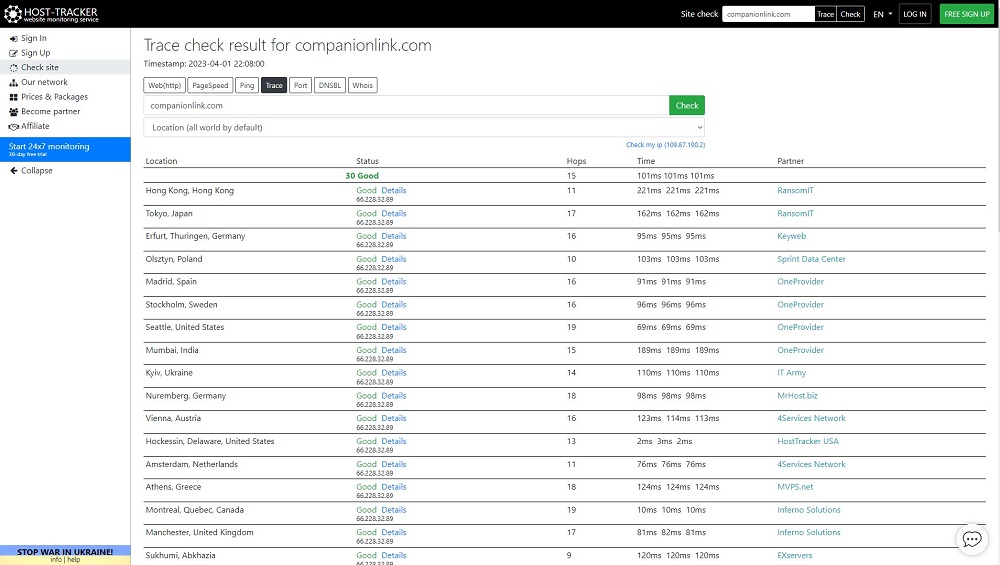
Among other things, it also includes monitoring database performance, server hardware temperature and load, as well as other parameters that can be affected in one way or another by users and their requests. This section also includes advanced network infrastructure monitoring, including using host-tracker web traceroute monitor service to detect and, if necessary, change various network parameters to improve website performance and access speed.
Thanks to the high-level tools it is possible to identify a large number of system and software problems of the website, as well as malfunctions of various elements. For this reason, advanced website performance monitoring is the main surveillance tool for developers.
Main website monitoring metrics and indicators
Website monitoring, as discussed earlier, requires not only an understanding of which tools to use in which situations, but also what they diagnose. That said, it is far from necessary to delve into the topic right away and learn how to understand the vast number of metrics and indicators that you need to pay attention to while reviewing monitoring logs or problem alerts.
For the novice website owner or novice webmaster, it is important to know about the most important metrics and indicators. Because they will be the most important ones when working not only with the website, but also with the related services. Moreover, they will be critical for search and advertising services, as well as for various affiliate programs. In other words – it is important to know and understand what metrics and indicators determine the reliability of a website for users and various systems.
Uptime
Website uninterrupted working time, or uptime, is the main metric that various systems, such as Google Ads or Google Search, focus on. It is the value of this metric that is crucial for determining the reliability of a website, so it should always be monitored, and that is why it is part of basic low-level monitoring.
In simple terms, uptime is the percentage of time a website has been up and running continuously versus when it is completely unavailable from the outside. In addition to the basic downtime caused by the complete unavailability of the server where the website resides, third-party services take into account any complete unavailability of the website. Even if it is caused by problems on the network side.
Page load time
Page load time is an indicator that is as important for third-party services as uptime. In this case, as well as uptime, this indicator is not unambiguous and accurate. As it is divided into two separate and their own important values – the loading time visible part of the page and the total load time.
Visible page load time – the time it takes for a user to visit a website and see the main content at the top of the page. It should not exceed 3 seconds, since this indicator is used not only by users (who, according to statistics, leave the site if it takes longer to load), but also by search and advertising services, such as Google Search and Google Ads.
Full page load time – The time it takes for all elements on a web page to fully load, from content and files to databases, functional elements and related third-party applications. It’s also considered by search and advertising services and is part of Google’s overall assessment of the reliability and performance of websites.
Database performance
Database performance is another important indicator of website performance, especially critical for online stores and other direct-to-consumer platforms. The more complex functionality becomes available to regular website visitors, the more important database performance becomes.
This is due to the fact that complex websites work with database queries much more frequently and intensively than simple websites. Which is quite logical and obvious. And properly configured database monitoring allows you to identify problems with query processing, the appearance of large queues, hangs, non-working data cells and so on. This, in turn, allows the webmaster to effectively optimize databases and significantly speed up the work of the website as a whole.
Server hardware performance
Given all the above-mentioned metrics, it is impossible not to mention the performance of the server – it is important to monitor it in order for the website to work as efficiently as possible, regardless of the load. In addition, a stable and fast-running server will immediately exclude iron faults from the list of sources of problems.
It is important to keep in mind that problems with the website itself affect the server in the same way that server problems affect the website. In other words, if the server hardware gets unusually high loads, and the other monitoring systems do not show any problems, then something in the website is not optimized. And the problem has grown to such an extent that it causes high loads on the server iron.
And in most cases with a high load on the server problems will be experienced in general the entire website, and slowly or unstably will work all of its functionality. This will lead to a deterioration of all of the above parameters and many other problems.