Technical analysis is a method of analyzing financial markets using historical data. In other words, the technical analysis aims to predict which way a given asset’s price will most likely move based on how it trades now and has traded in the past.
Technical analysis can be defined as the analysis of assets based on historical price and volume data in its most basic form. With this method, you examine how an asset’s price has changed over time and how it compares to previous price patterns and volume. The main assumptions of technical analysis are that price and volume data accurately reflect all, or at least the majority, of the information relevant to you as an investor or a trader and that specific price/volume patterns, tend to repeat themselves over time.
Suppose you look at the price of Silver to get an idea if it could trade higher or lower on the best time predictions that suit your trading style (Within a day). You notice that Silver has appreciated for five days in a row. So you go and look at all the historical prices of Silver and search for the situations in which Silver appreciated for six days straight.
You collect the data for all these situations similar to the current one and look at what happened in these situations on the sixth day. Suppose that you find that in an overwhelming majority of the cases, say 95%, the sixth day is a day of strong appreciation. You can conclude that patterns tend to repeat themselves in time and that the next day on your current analysis is more likely to be a day of strong appreciation based on the observation of past data.
Technical analysis is not based on the daily timeframe only. It can be implemented in various time frames that suit your trading style. When incorporated with an in-depth understanding of price action and multi-timeframe analysis, technical analysis can serve you like a King.
The patterns in the market can sometimes be more choppy and complicated than the one described. You should also keep in mind that there are different formulations of technical analysis that allow you to look at Silver market data from different perspectives. Some go beyond price/volume consideration to incorporate other data sources to help you filter your doubts and take trades that will work to your advantage.
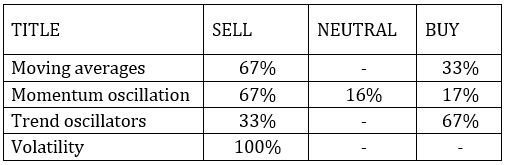
Some of the most used technical analysis tools are not limited to Relative Strength Index (RSI), Support and resistance, and trends analysis of the volume. This list doesn’t suggest that these tools are more accurate than others. You should always strive to stick to the indicators that you understand best and apply the knowledge in this article to get the most out of your trades.
Charting on Different Time Frames
Time frame and technical indicator of choice are probably your main recipes as a technical silver trader. This works in combination to predict the silver market’s next price movement.
Technical analysis time frames range from 1 minute to yearly. Your personal trading style determines the time frame you choose while analyzing the markets as a silver trader.
As an intra-day silver trader, traders who open and close silver trading positions within a single day would probably analyze silver price movement on shorter time frame charts, such as 5-minutes or 15- minutes. However, unlike intraday silver traders, long-term silver traders can hold their position for days or weeks.
The market is said to be fractal. So the price action you see on the daily silver charts is what is seen in the lower time frames as well. So that means analysis done on lower time frames can also be held for days or weeks when done correctly.
One of the simple ways to demonstrate is to view the same price action on different time frame charts. For example, the following daily chart for Silver shows the price trading lower, roughly $20 to $22. Because the RSI is also approaching the oversold area as a long-term silver investor, you might be tempted to buy Silver.
In your multi-timeframe analysis, you might find that the trend on the daily chart doesn’t match the one on the four-hour. So you’ll wait for the price action to speak the same language before entering a trade based on RSI.
Silver Technical Analysis
Silver, the white metal, is also a financial asset that you can easily trade. In addition, it can be subjected to technical analysis because there is historical data for it. In this case, we’ll use the RSI and a specific pattern as an example for Silver. Take a look at the chart below to understand better what we are looking at.
We can see that the RSI has a strange pattern on this chart. There was an initial move to or above the 70 lines on the RSI, followed by a move lower in the index, and then another move higher, which topped above the level of 80 and was followed by a move lower in the RSI in some cases. The long-term tops in 2004, 2006, and 2008 were all preceded by this specific RSI pattern. Was the next top affected by the same pattern? You could probably be asking this question while doing your technical analysis.
It was, indeed. As a result, using technical analysis to analyze the silver market, and in particular, using this specific pattern in the RSI as a top indicator could have been extremely beneficial to you as silver investors or traders, as Silver fell precipitously in 2011 and ended the entire 2000/2001-2011 bull market almost exactly when the discussed signal was flashed.
Conclusion
When applied correctly with a lot of patience to wait for trades to come to you, technical analysis can be one of your long-serving servants in the silver market.