The stock market is a place where stocks are bought and sold. The stock market comprises exchanges and networks of organizations that deal in stocks and other securities. The exchanges are where stocks and other securities are bought and sold. The two largest exchanges in the United States are the New York Stock Exchange (NYSE) and the NASDAQ. Keep reading to learn more.
How Do You Read Stock Market Report Finance Charts?
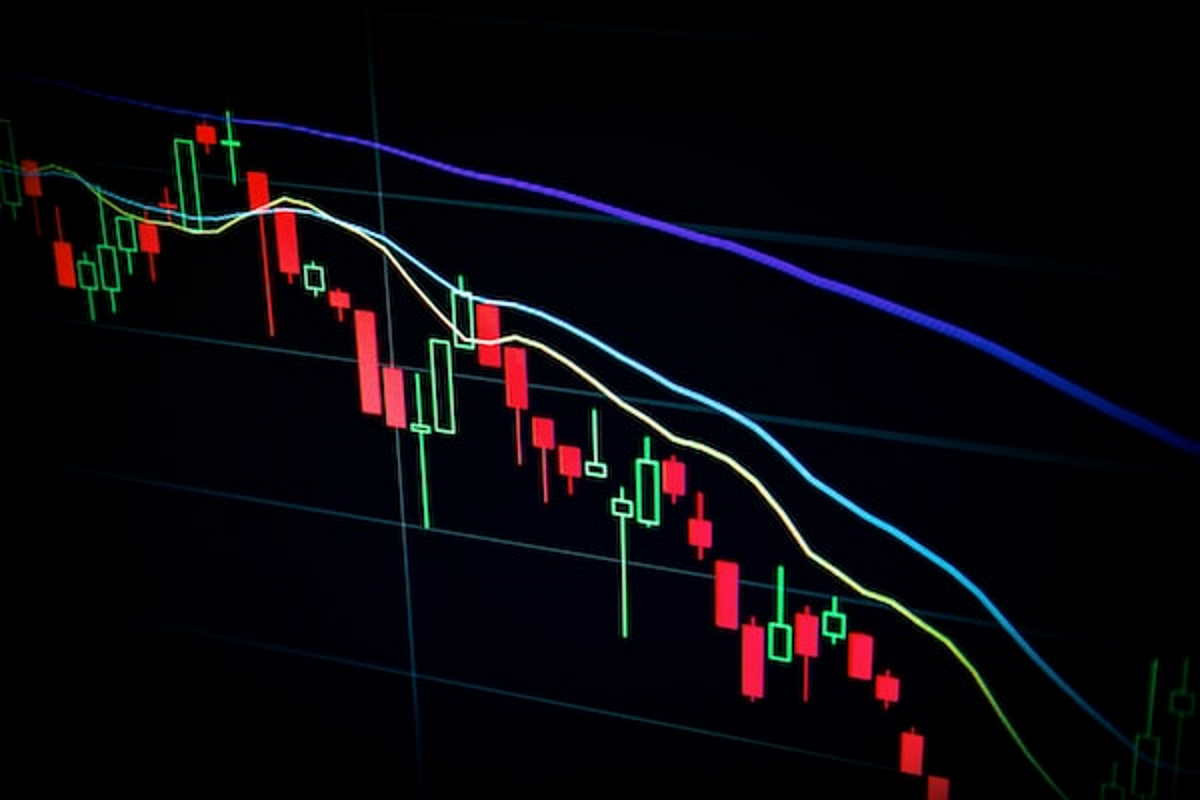
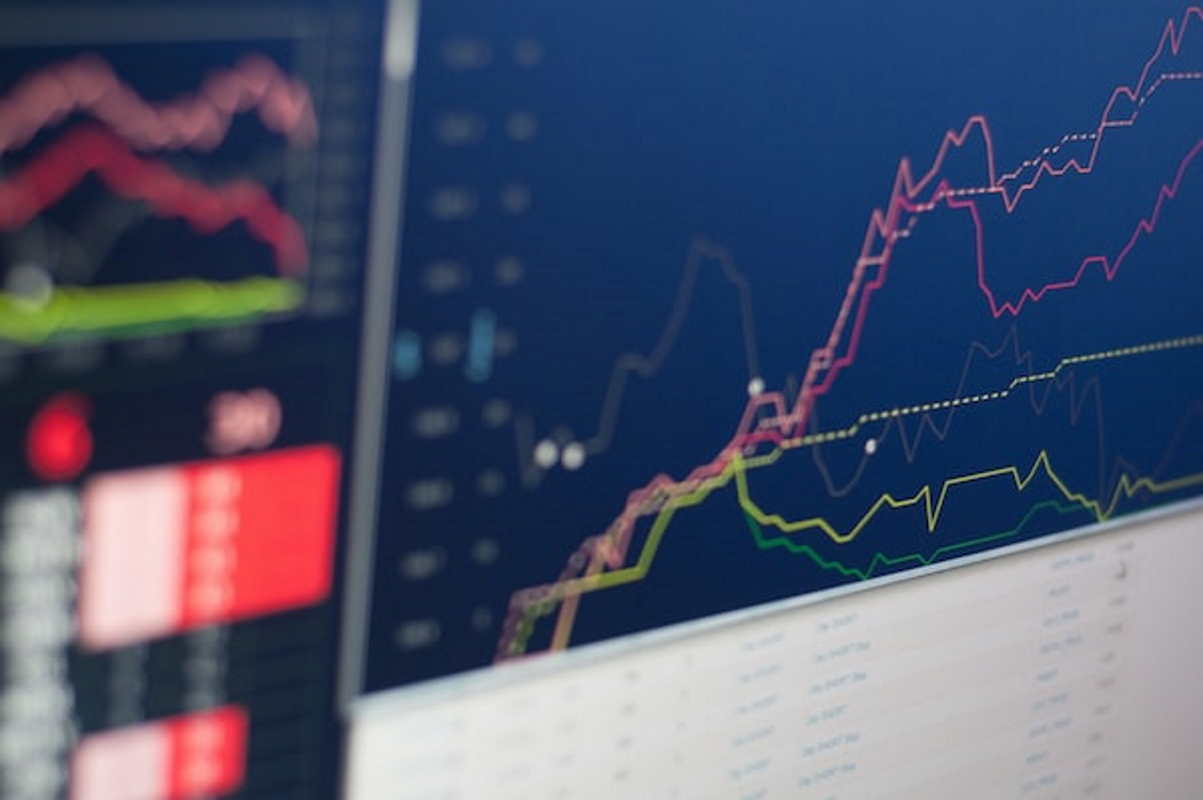
When it comes to finance charts, there are a few things that you need to take into account to make the most out of them. Finance charts of a company are used to track and analyze the company’s financial performance over time. The most common type of finance chart is the line chart, which shows the company’s revenue, profit, and expenses over a period of time. Another type of finance chart is the bar graph, which shows how much the company has earned or spent in different categories over time.
The first thing to consider is the time frame represented in the chart. This will give you a snapshot of how the company is doing over that time frame. The second thing to consider is the scale of the chart. You’ll want to notice if the y-axis measures in percentages or absolute numbers. This will tell you how much the company has changed over the time frame being represented. Lastly, consider the trend represented in the chart, and if it’s going up, down, or staying the same. This gives you an idea of where the company is headed.
The stock market is important because it’s one of the ways that businesses can raise money. When a company sells stocks, it’s selling a share of ownership in the company. This means that the company is allowing people to own a part of the company and share in its profits.
The stock market is also important because it’s one of the ways that people can invest their money. When people invest in the stock market, they buy stocks in hopes that the stock will increase in value. If the stock does increase in value, the investor can sell the stock for a profit.
Why Can Tracking Industry Trends Be Helpful?
When looking at stock market reports, it’s important to understand the trends within the industry. This will give you a better idea of which stocks may be worth investing in. There are many different types of trends that can be tracked, but here are a few examples:
Technological trends: Technology is constantly evolving and changing. Stock analysis platforms, data mining, and statistical modeling are great examples. Companies that stay ahead of the curve by investing in new technology will likely see increased profits.
Economic trends: The economy goes through cycles of growth and recession. Stocks that are impacted by these cycles can be good investment opportunities.
Political trends: Political changes can impact specific industries differently. For example, if there is a change in government policy that favors renewable energy sources, companies involved in renewables could see an increase in profits. Conversely, if there is a change in government policy that favors fossil fuels, companies involved in fossil fuels could see an increase in profits.
How Can You Use Technical Analysis in the Stock Market?
Technical analysis is a method of evaluating securities by analyzing statistics generated by past market activity. Technical analysts believe that these statistics can be used to predict future movements in the security’s price. There are many technical indicators, but some of the most popular include moving averages, relative strength indexes, and Bollinger bands.
Technical analysts use charts to track these indicators over time and to spot trends. They also use trendlines and other chart patterns to identify potential buy and sell points. Many technical analysts also follow news events closely to try and understand how they might impact a particular security’s price.
While there is no guarantee that technical analysis can help investors make money in the stock market, it can be a valuable tool for those who understand how it works.