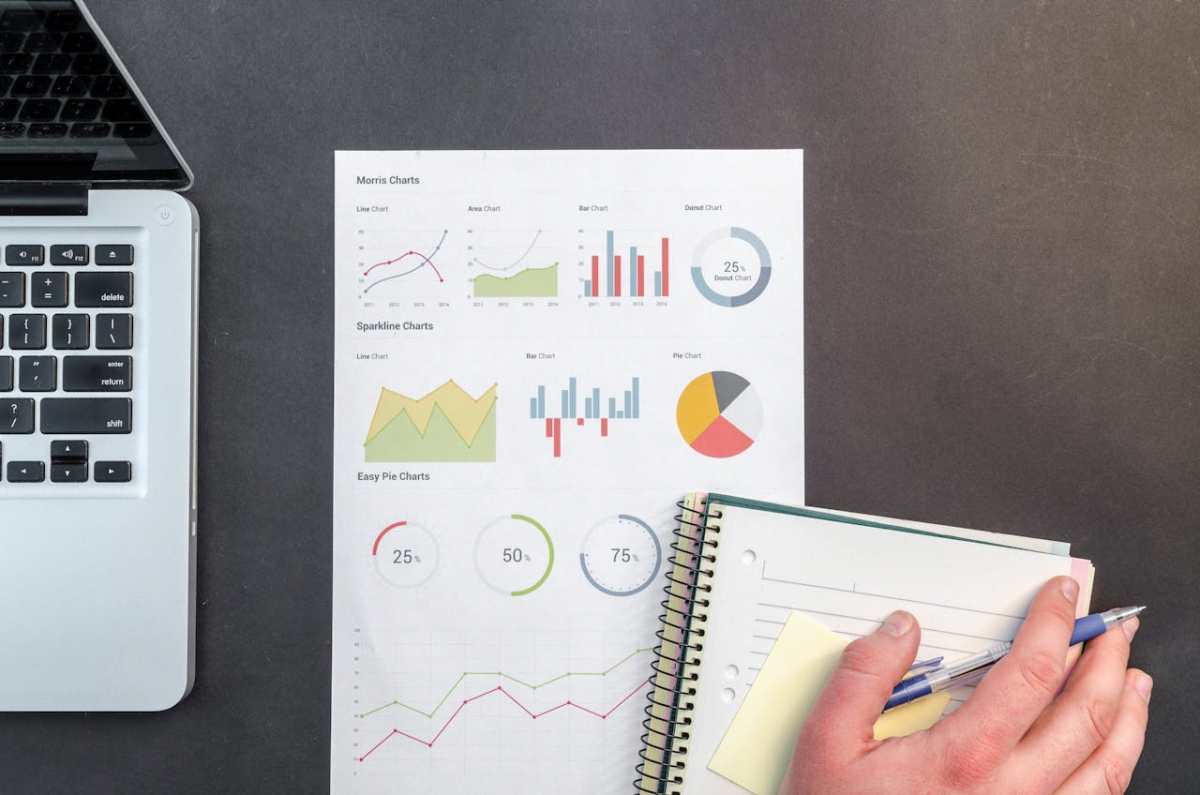
Global financial markets are increasingly complex by the day. Modern investors are neck-deep in reports and data from multiple sources, and they must make sense of them to build profitable portfolios. That is why investors are upgrading their software tools to move beyond static analysis to real-time dynamic data visualization.
For the modern investor, access to market data from online sources is a game-changing innovation that was not available fifty years ago. With this advantage, however, has come the need for constant upgrades. Why? Traditional investment tools are failing to keep pace with dynamic data-saturated markets.
They are also limited in the amount of data they can process. With data volumes doubling every 2-3 years, legacy systems cannot keep up, leading to storage and processing bottlenecks that make it difficult for investors. And given that 80-90% of global data is now unstructured, investors have to make sense of market sentiments from social media, news, videos, PDFs, and other data sources. A near-impossible task with legacy tools.
The failure of legacy systems to handle financial market data led to the development of Tradingview and other modern charting platforms.
Here are five things investors enjoy when upgrading their trading tools.
Upgrading software and trading tools today requires deep research, as there are many similar tools. Driven by the goals of speed and efficiency, investors are moving to tools that actively interpret data rather than merely display it. There are four key features to look for in an upgrade.
AI also makes instructions easier. Instead of writing code or complex SQL queries, for instance, investors can use a simple voice command to get a list of semiconductor stocks with rising inventory but falling stock prices within the last 48 hours. This is unparalleled time-saving!
Ultimately, any upgrade should improve investors’ decision-making and trade outcomes. There are, of course, no fixed rules regarding upgrades. Investors must audit their current constraints and then identify the exact solutions that improve their system.
Data visualization is the competitive edge that modern investors have, with free tools available and premium, specialized tools accessible. Analytical tool upgrades improve visualization and enable investors to make real-time decisions while studying live charts. Every investor looking to upgrade their tool stack must audit gaps and then choose better tools.
Career schools operate in a highly competitive environment where attracting, nurturing, and enrolling prospective students…
Which marketing agency is right for your renewable energy company? The best fit depends on…
Compare top enterprise MDR services for regulated organizations and DIB contractors. Learn how to evaluate…
Maintaining outdated software creates massive operational bottlenecks. According to recent research, corporate IT departments spend…
Small businesses increasingly need visual content for product pages, presentations, advertising, social media, and customer…
Every day, reporting is seen as a chore and often overlooked due to its perceived…