Indicators for trading in five categories: Mean Reversion, Momentum, Trend, Relative Strength, and Volume. These indicators can also be used in combinations to make them work more smoothly. Continue reading
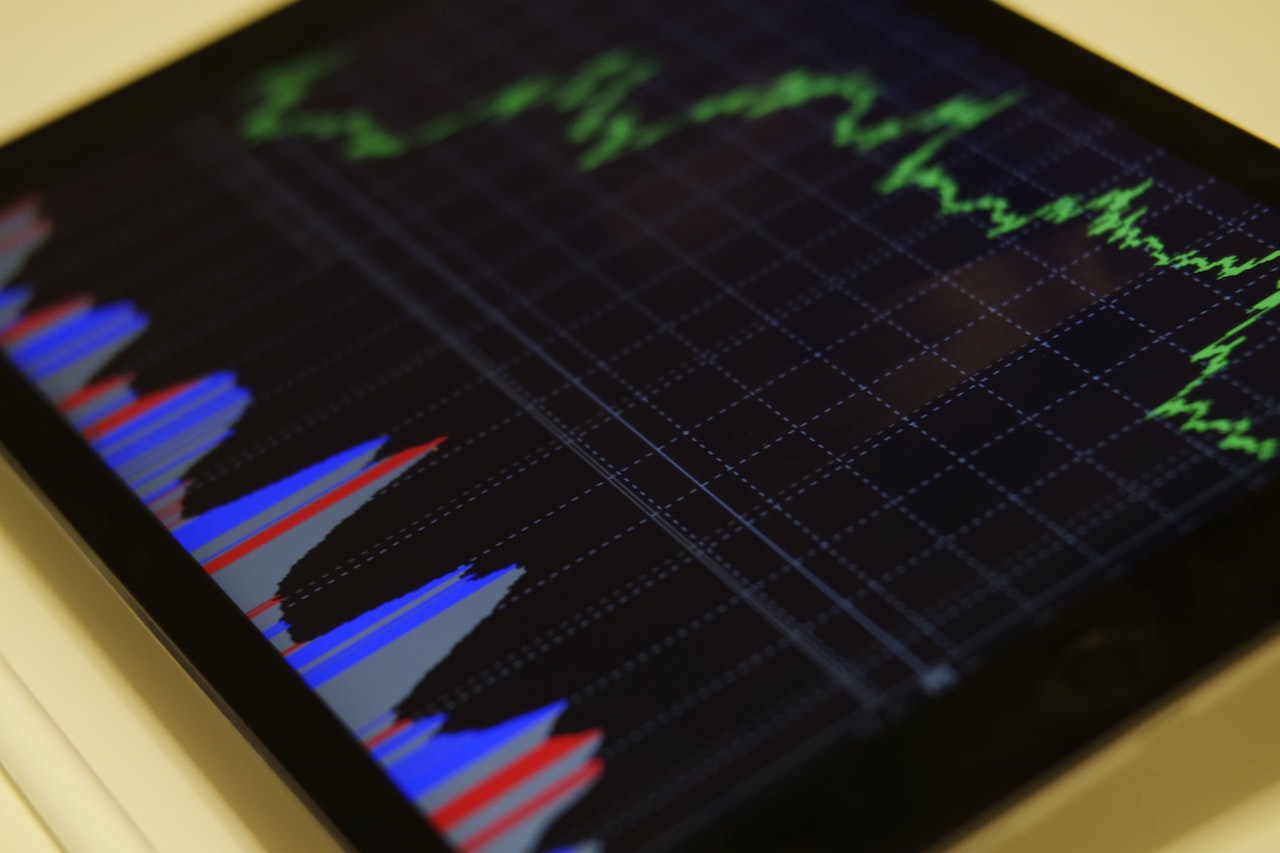
Indicators are mathematical codes which are introduced as lines on a trading chart. They help traders figure out different trends and signs of price changes in the market. These indicators also play a role to identify the supply and demand of customers, along with the entry and exit points of a trade.
People often confuse these indicators as mt5 indicators, but they’re not the same. It’s important for traders to be aware of the best indicators to detect the proper price ranges going around in the market. If you want to know more about the best indicators for trading, read along to find out.
Used to detect pricing trends in the market, most trading indicators also tell you the highs and lows going around in a trade. We have mentioned the top 8 indicators for trading you can choose from below.
EMA is a form of moving average, but it carries more weightage on the data and as a result, more information is gathered. The Exponential Moving Average reacts to moving prices faster than an ordinary moving average. Different EMA lengths are used, but 10-day, 50-day, and 200-day are the most common.
Bollinger Bands are a great trading indicator because of their exceptional range, which is plotted above and below the moving average of the price. They are plotted as a standard deviation, and that’s how they adjust to moving prices. Bollinger bands are used to find out if the prices going around in the market are high or low with the help of a moving average.
A stochastic Oscillator uses a scale of 0-100 to compare the closing price of an asset to its previous prices. This shows the trend strength in the market and how much momentum each of them has. By the scale of the stochastic oscillator, you can determine pricing trends. Any reading below 20 indicates an oversold market, and a reading above 80 indicates an overbought market.
Relative Strength Index or RTI is used to figure out the momentum and trend of prices in the market. It also uses a scale of 0-100 to indicate different price signals. An asset that is under 30 is considered oversold, and one above 70 is considered overbought. It works as a momentum oscillator, indicating the speed at which a price is moving and changing.
Average Directional Index or ADX is another trading indicator with a scale of 0-100. An asset above 25 indicates a strong trend, while an asset below 25 indicates a decline. These indications help the trader know whether a pricing trend is here to stay or not. ADX is based on the moving average of 14 days, on the frequency that the trader prefers.
One downside of ADX is that it’s just used for the price trend and not to find out how it develops.
This trading indicator compares two moving averages to detect the momentum of prices. It works on the principles of convergence and divergence. Convergence of averages indicates that they are coming together, and divergence means that the averages are moving away from each other. When averages are converging, momentum between the prices is decreasing and when the averages are diverging, momentum is increasing.
On Balance Volume takes up all the volume information of momentums and makes it into a one-line indicator. These volumes are compiled by taking the volumes from up days in the market and then leaving out down day volumes. A rising place in the market is indicated by a high On Balance Volume, and a lower price is indicated by a low On Balance Volume. It also uses volume changes to predict prices and is the best indicator to know about breakouts and breakdowns.
Accumulation/Distribution Index is a commonly used trading indicator that is similar to On Balance Volume. It not only indicates the closing price of a trend but also indicates the trading range for a specific period, even offering a comparison between stock price and volume flow. This indicates the strength and weight of a trend.
Most of the indicators for trading are available in five categories: Mean Reversion, Momentum, Trend, Relative Strength, and Volume. You need to know which type of indicator you are looking for, so you can go ahead with your trading and accurately detect price ranges in the market.
These indicators can also be used in combinations to make them work more smoothly. For example, if you want to use the divergence method in trading, you can combine Moving Average Convergence Divergence, Relative Strength Index, and Stochastic Oscillator for your trading strategy.
Moss agate has been valued for centuries as a stone of growth and new beginnings…
One revision to a machined aluminum profile is often described as a small drawing update:…
The Quiet Revolution in Post-Production When people talk about AI and content creation in 2026,…
Every creator has watched a video they were proud of stall at a few hundred…
Nobody budgets for the morning the walk-in cooler reads 54°F, or the afternoon the office…
Getting the call that someone you love has been arrested is one of the most…